 What are Lead Performance Metrics?
Lead Performance Metrics are a set of data points indicating how well your Leads and Campaigns are performing. Some of the data we can automatically gather on your Campaigns, but most of the power of these Metrics depends additional data points collected by Managing your Leads or using our Call Insights Service.
Lead Performance Metrics can become a powerful insight tool to help you see the effectiveness of your Campaigns and your ROI. You can manage your Leads yourself, or if you would like us to Manage Leads on your behalf you can take advantage of our Call Insights Service.
Headline vs Detailed Performance Metrics
The Headline Lead Performance Metrics are always visible at the top of the Lead Manager and Dashboard pages and the Detailed Lead Performance Metrics are accessible by clicking the "View Performance Metrics" link at the top left of the Lead Manager Table.
Both main Metric areas are described below along with distinguishing between Basic and Advanced Metric types.
Headline Performance Metrics
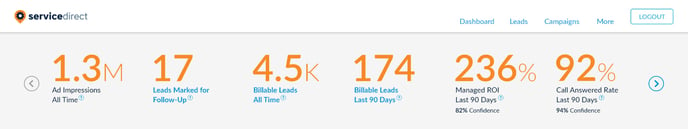
At the top of the Lead Manager and Dashboard sections of mySD, we display the most common Metrics to help you understand our service performance. The right and left arrows cycle through various Metrics.
Headline Performance Metrics include both Basic Metrics, which we can automatically calculate for you, and Advanced Metrics, which require some Lead Management from you to be reliable.
Basic Performance Metrics
Ad Impressions
This metric describes the reach of your Company through our Ad Networks and corresponds to how many times your Ads have appeared in the search results of the targeted audiences seeking your services. Impressions are influenced by many factors, including service demand, Service Area, service offerings, and even Cost Per Lead, which contributes to your ads' competitiveness. We continually optimize and market your Company to as many likely potential customers as possible.
Leads Marked for Follow-Up
Shows the current number of Leads that you have marked as needing Follow-Up. You can click the link in the Metric directly or use the “Leads for Follow-Up” Quick Filter on your Lead Manager to see these Leads.
Billable Leads (All Time and Last 90 Days)
Both the cumulative amount of Billable Leads from the moment your Campaigns went live to the current period (All Time) as well as the number of Billable Leads received in the past 90 day period are displayed here. You can click the links in these Metrics to jump to the Lead Manager and see these Leads.
Advanced Performance Metrics (beta)
The following Advanced Performance Metrics use data from the Lead Progress you Manage. Managing a Lead means inputting the necessary Lead Progress data corresponding to the particular Metric, described in detail below for each.
Managed Return On Investment (ROI) Last 90 Days
This ROI percentage is calculated using only the Billable Leads from the Last 90 Days for which you have input Job Revenue. We also include Leads that you have marked as Job Not Won because we automatically assign a Revenue of $0.00 to those Leads. Managed ROI is calculated as:
(Sum of Job Revenue - Sum of Lead Cost) ÷ (Sum of Lead Cost)
Revenue is considered Managed when a user has saved a Revenue dollar amount on the Lead or the Lead has been Marked Job Lost, which records $0.00 Revenue, providing us the data on which we base the calculations. Without Revenue input, we can't display accurate ROI.
The ROI Confidence describes how confident we are in this Metric's accuracy and is based on the percentage of these Leads that have had Revenue entered. The more Leads with Revenue, the more accurate the Metric becomes. Confidence is calculated as:
(Number of Leads with Revenue Managed) ÷ (Number of Billable Leads)
The more Leads you manage by adding Revenue, the higher our ROI Confidence climbs because we have more of your actual data to calculate from.
This Metric is Locked until you have Managed the Revenue on more than 60% of your Billable Leads.
Calls Answer Rate
This shows the percentage of Leads from the Last 90 Days that you have Managed as "Call Answered Yes / No" and also includes "Forms Responded to Yes / No" for Form Leads. Maintaining an excellent Call Answer Rate is necessary for converting as many inbound Leads as possible into new customers. Call Answer Rate is calculated as:
(Number of Leads with Call Answered Yes or Form Responded to Yes)
÷
(Number of All Leads)
Call Answer Rate Confidence describes how confident we are in this Metric's accuracy and is based on the percentage of these Leads that have had Call Answered Managed. The more Leads Managed, the more accurate the Metric becomes. Confidence is calculated as:
(Number of Leads with Call Answered (or Form Responded to) Yes or No)
÷
(Number of All Leads)
Jobs Won Rate
This percentage shows how often you turn an opportunity (Billable Lead) into a new customer. Understanding your Jobs Won rate gives insight into optimizing your Cost Per Lead in order to aim for the most Leads at the cost that makes sense for your business. Jobs Won rate is calculated as:
(Number of Leads with Job Won Yes) ÷ (Number of All Billable Leads)
Jobs Won Rate Confidence describes how confident we are in this Metric's accuracy and is based on the percentage of these Leads that have had Job Won Managed. The more Leads Managed, the more accurate the Metric becomes. Confidence is calculated as:
(Number of Leads with Job Won Yes or No) ÷ (Number of All Billable Leads)
This Metric is Locked until you have Managed Lead Progress for Jobs Won on more than 60% of your Leads.
Booked Appointment Rate
Displays how often you convert an opportunity (Billable Lead) into an appointment with a potential customer. As with all Advanced Performance Metrics, the accuracy is dependent on how many Leads have Lead Progress Managed.
(Number of leads marked Booked Appointment) ÷ (Number of Managed leads)
Detailed Lead Performance Metrics
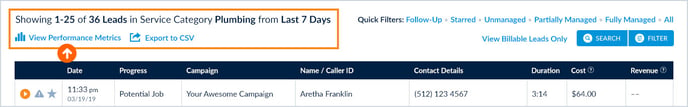
On the top left of the Lead Manager table, click the "View Performance Metrics" link to see a detailed report for the Currently Filtered Leads you are viewing in the Lead Manager.
Note: the Currently Filtered Leads are always described in a plain-English sentence at the top left of the Lead Manager Table. You can change which Leads you're viewing by using the Quick Filters or the Advanced Search and Filter features on the top right of the Table.
You will then see a popup showing a report of our Detailed Lead Performance Metrics as described for each Metric below.
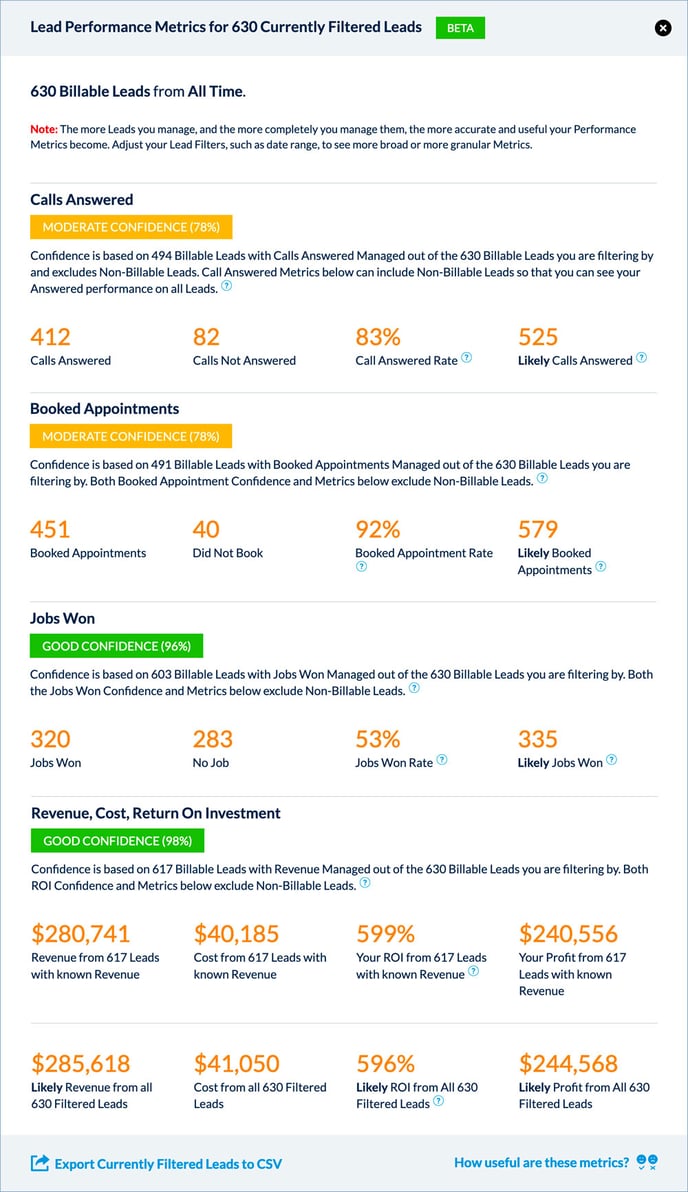
Calls Answered, Booked Appointments, Jobs Won, Revenue and ROI
Each main area of Metrics has its own section with several Metrics each. Many are self-explanatory and others have question mark Tooltips available with more information. Some of them are described further up in this article where we explained the corresponding Metric within the Headline area.
Tip: Remember that we base these Metrics off of the Lead Progress data that you have Managed in each of the sections. Some Clients track everything consistently and others focus on particular Metrics of interest for their business.
The more consistently you Manage Leads, the more Confidence we have in the Metrics.
For Example: In the above image, the Call Answer section of Lead Progress has had 78% of the Leads Managed (giving us Moderate Confidence) whereas the Jobs Won section has had 96% (Good Confidence) and Revenue/Cost/ROI section has had 98% (Good Confidence) of Lead Progress Managed for each of those different data points. The higher the percentage, the greater the Confidence we have that the Metric is accurate.
Likely Performance Metrics
While there is no such thing as perfect data, it is our goal to show you our best guess for what we believe to be closest to the truth in each Performance Metric section by calculating Likely Performance Metrics. We make up for any incomplete data by taking the average for it from across our entire network for your Service Category. We blend those network averages with your own data to provide the most Likely reality.
Tip: These Likely projections get more accurate as you input data into the system by Managing your Leads. If the Likely Metrics are lower than the Metrics based only on your data, then you are performing better than the average of your peers in our network.
Export Currently Filtered Leads to CSV
Click the links at the top and bottom of the Lead Manager Table or at the bottom left of the Detailed Lead Performance Metrics report popup to export and download a CSV file of the Leads you're currently viewing. You can then further analyze that raw data in a spreadsheet or CRM program.