
What is Call Insights?
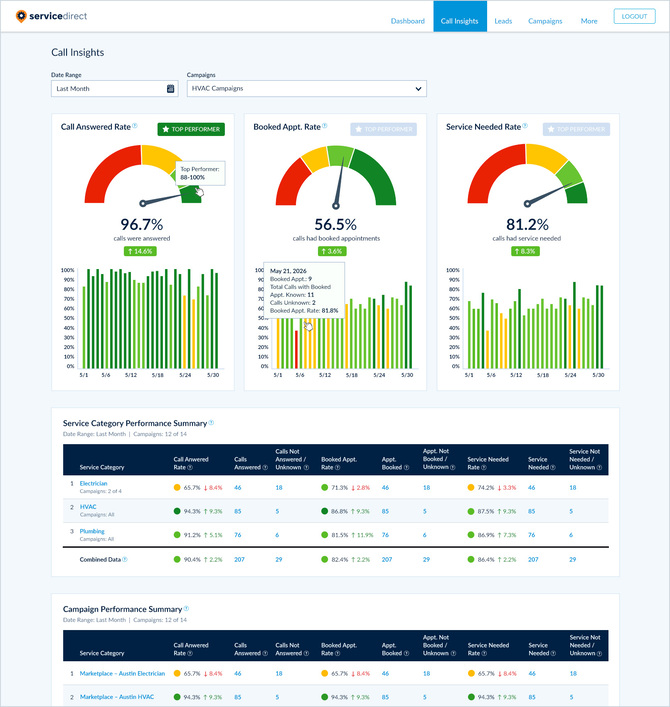
Call Insights is a page in mySD that shows what happens after your phone rings. It answers three questions about the calls you receive from Service Direct:
- Are you picking up? (Call Answered Rate)
- Are calls turning into appointments? (Booked Appointment Rate)
- Do callers need the service you offer? (Service Needed Rate)
Each rate is compared with other businesses in your Service Category, so you can see where you're strong and where there's room to grow.
You don't have to tag or log anything. Service Direct analyzes every call automatically, so Call Insights covers all of your calls, not just the ones someone remembered to write down.
How to open Call Insights
- Log in to mySD.
- Click Call Insights in the main menu at the top of the page.
Choosing what to see
Use the filters at the top of the page to choose which calls are included. They work the same way as the filters on your Dashboard.
- Date Range: the period you want to review, such as Last Month or Last 30 Days.
- Campaigns: one, several or all of your campaigns.
- Companies: if you manage more than one company, choose which companies to include.
Everything on the page updates when you change a filter.
The three rates
Call Answered Rate
The percentage of your calls that were answered, out of all calls where we could confirm whether they were picked up or not. The more calls you answer, the more chances you have to turn callers into customers.
Booked Appointment Rate
The percentage of the calls you paid for that resulted in a Booked Appointment. Occasionally, Non-Billable calls can also result in Booked Appointments and will contribute positively to your Booked Appointment Rate.
Service Needed Rate
The percentage of your answered calls where the caller needed a service that's typical for your Service Category. This rate is most accurate within a single Service Category, so it's only shown when your Campaigns filter is set to campaigns in one Service Category.
Tip: Hover over the ? icon next to any rate to see its definition right on the page.
Reading the gauges
Each rate has its own panel with a gauge, your rate and a daily chart.
The rating bands
The gauge's dial is split into four colored bands:
| Color | Rating |
| Red | Poor |
| Yellow | OK |
| Light Green | Great |
| Dark Green | Top Performer |
The needle points to where your rate falls. Hover over any band to see the range it covers, for example Top Performer: 88–100%.
The bands are based on benchmarks for your Service Category, so an HVAC company is compared with other HVAC companies, not with plumbers or electricians.
If your filters include Campaigns from more than one Service Category, the bands blend those categories' benchmarks, giving more weight to the categories you have more calls in.
Top Performer badge
When your rate reaches the dark green band, a Top Performer badge lights up at the top of the panel.
Your rate and how it changed
Below the gauge you'll see your rate for the selected Date Range, along with a green or red flag showing how much it went up or down compared with the previous period.
The previous period is always the same number of days as your Date Range, immediately before it. For example, if you choose Last Month and that month had 30 days, your rate is compared with the 30 days before it.
No change is shown when the Date Range is set to All Time, because there's no earlier period to compare with.
Daily chart
The bar chart shows your rate for each day in the Date Range. Each bar is colored by the same rating bands as the gauge, so you can spot good and bad days at a glance. Hover over a bar to see that day's numbers, including how many calls went into the rate.
Performance Summary tables
Below the gauges, two tables break your results down further:
- Service Category Performance Summary: one row per Service Category. Under each category name, you'll see how many of its campaigns are included by your Campaigns filter (for example, Campaigns: 2 of 4).
- Campaign Performance Summary: one row per campaign. If you manage more than one company, this table also shows a Company column.
Each table shows all three rates, with the call counts behind each one:
| Column | What It Shows |
| Call Answered Rate | Your Call Answered Rate, with its change vs. the previous period |
| Calls Answered | Calls that were answered |
| Calls Not Answered / Unknown | Calls that weren't answered, or where we couldn't confirm it |
| Booked Appt. Rate | Your Booked Appointment Rate, with its change vs. the previous period |
| Appt. Booked | Calls that resulted in a booked appointment |
| Appt. Not Booked / Unknown | Calls that didn't result in a booked appointment, or where we couldn't confirm it |
| Service Needed Rate | Your Service Needed Rate, with its change vs. the previous period |
| Service Needed | Calls where the caller needed a service you offer |
| Service Not Needed / Unknown | Calls where the caller didn't need a service you offer, or where we couldn't confirm it |
The colored dot next to each rate matches the gauge's rating bands. The Combined Data row at the bottom totals every row in the table.
Digging into the details
- Click a Service Category or campaign name to focus the page on it.
- Click any call count to open Lead Manager with the matching calls for the same Date Range, so you can listen to recordings and see exactly what happened on each call.
Why you might see a message instead of a gauge
Why can't I see my Service Needed Rate?
If you see a lock icon and the message "Set your Campaigns Filters to a single Service Category to view this data," your Campaigns filter includes campaigns from more than one Service Category. What counts as a "service needed" call is different for each category, so this rate is only shown for one category at a time. Change the Campaigns filter to campaigns from a single Service Category to see it.
"Your call insights will appear here after your first call."
Your account hasn't received any calls yet. Your rates will appear once calls start coming in.
"Your call insights could not be loaded. Reload the page to try again."
Something went wrong while loading your data. Reload the page. If the message keeps appearing, contact your Account Manager or our support team.
How the data is measured
Service Direct uses AI to analyze every call and detect the outcome behind each of the three rates:
- Answered: whether a person picked up the call.
- Service Needed: whether the caller needed a service that's typical for your Service Category.
- Booked Appointment: whether the call ended with an appointment on the books.
Our call reviewers also check results through Quality Check, our call review process, to keep the data reliable.
For you, that means:
- Nothing to log. You don't have to fill out a form or tag a single call.
- The whole picture, not a sample. Call Insights reflects all of your calls.
- A fair comparison. The same process measures every business, so your rates mean the same thing as everyone else's in your Service Category.
How current is the data?
Call Insights updates in near real time. New calls appear after a delay of about 15 minutes, and the page notes this delay. If you don't see a call that just ended, check back shortly.
Where to focus
Taken together, the three rates can show you where calls are being lost:
- Low Call Answered Rate? You're paying for calls that go unanswered. Lunch breaks, busy afternoons, after-hours gaps and full voicemail boxes all add up. Better staffing, call routing or an answering service is often the fastest improvement available. In our data, clients in the top tier for answering calls are about 1.7 times as likely to book an appointment on the calls they pay for.
- Low Service Needed Rate? This one measures how well we're matching you with the right callers. Talk with your Account Manager so we can look at it together.
- Strong answering and Service Needed, but low Booked Appointment Rate? The opportunity is in the conversation itself: how your team greets callers, handles price questions and asks for the appointment. Small improvements here pay off on every call, from Service Direct and every other channel you use.
Need help reading your numbers?
If you have an Account Manager, click Schedule a Call at the bottom of the Call Insights page to book time with them. They'll walk through your results with you and help you decide where to focus.
If you don't see that option, contact our support team and we'll be happy to help.